Category: Local SEO

  • Google Business Profiles Tests AI That Sets Your Hours Automatically

    Google Business Profiles Tests AI That Sets Your Hours Automatically

    Google is testing a feature inside Google Business Profiles that lets a merchant describe opening hours in plain text and have the platform fill in the structured schedule automatically. The goal is a cleaner, faster way to keep local listings accurate across Google Search and Google Maps, with less manual data entry for small business owners.

    What the feature looks like

    The test surface shows a prompt labeled “Set your hours automatically” with the instruction “Describe your opening hours. Google will extract your hours and update them below.” A merchant types a sentence such as “closed Sundays, open 9 to 6 weekdays, 10 to 4 Saturdays,” and the system applies the parsed schedule to the business listing without the merchant having to click through each day of the week.

    Why it matters for local listings

    Business hours are among the most frequently updated fields on a Google Business Profile. Restaurants shift seasonal schedules, retail stores change holiday hours, and service businesses rotate availability by location. Each manual edit costs time, and a missed update can mislead a customer who drove across town to a closed door.

    An automated extraction flow reduces that friction. A merchant writes hours once in natural language, and the structured output feeds the local panel that appears in Google Search and Google Maps. The hours stay consistent across every surface Google uses to display a business.

    How the hours reach the local panel

    Once parsed, the hours populate the same structured field that already powers the hours shown on the local knowledge panel. Google Search, Google Maps, and any third party that reads the Business Profile data all draw from that single source, so one update propagates everywhere a customer might look.

    What merchants should watch for

    Accuracy is the test that matters. If the system misreads a range, such as “noon to 9 pm” parsed as 12 am to 9 pm, the merchant loses the time savings to a correction cycle. During the test phase, it is worth checking the parsed result against the original description before saving.

    Consistency across directories is a related concern. Google may hold the correct hours, but other citation sources still need to match. Tools like BizScoreAI track how a business appears across listings and surface mismatches that can confuse both customers and AI search engines.

    Status of the test

    The feature is currently a limited test within Google Business Profiles. A wider rollout has not been announced, and there is no confirmed timeline for when, or whether, it will reach every Business Profile manager.

    FAQ

    What is the new “Set your hours automatically” feature in Google Business Profiles?

    It is a test that lets a merchant describe opening hours in plain text and have Google extract and apply them as a structured schedule on the Business Profile.

    How does Google decide what hours to set?

    Google uses AI to interpret a free-text description of opening hours and converts it into the structured day-by-day schedule that appears on the local panel in Google Search and Google Maps.

    Will the automatic hours replace manually entered hours?

    The feature is still in testing. During the test, merchants can compare the AI-parsed hours against their original description before applying them, which helps catch any extraction errors before they go live.

    BizScoreAI

    BizScoreAI, which includes the free listing check

    BizScoreAI has the free listing check scores how visible a business is to AI search and shows what its listing looks like to the engines people ask. Open the free listing check.


    This article summarizes reporting from seroundtable.com.

  • Google Tests Larger Image Local Service Ads Design

    Google Tests Larger Image Local Service Ads Design

    Google is testing a redesigned Local Service Ads layout that pairs larger ad images with a prominent highlight box underneath the listing, giving the format more visual weight in the search results. The change signals that Google is putting more resources behind Local Service Ads as the format migrates into the main Google Ads platform.

    What the new design looks like

    The test version of Local Service Ads enlarges the accompanying image and adds a visible highlight box beneath the main ad card. The effect is a noticeably larger ad footprint that stands out from the surrounding organic listings.

    Google has explored larger images in Local Service Ads before. Earlier experiments used expandable image treatments, but the current test is a different layout, and it lands at a time when the company is investing heavily in the ad type.

    Why the timing matters

    The redesign is part of a broader shift of Local Service Ads into the Google Ads ecosystem, which changes how advertisers buy, manage, and measure these campaigns. Larger visuals and a highlight box fit that strategy by drawing more attention and giving the placement more presence on the search results page.

    For local advertisers, this is worth watching because Google is serving Local Service Ads in more placements and giving them more on-screen real estate. Ad units that take up more space tend to change click behavior, and a wider visual footprint can pull attention away from organic results in the same view.

    What local advertisers should watch

    • Placement changes. If the unit expands into more SERP areas and shows up more often, expect shifts in cost per lead and in which queries trigger Local Service Ads versus standard Google Ads.
    • Image assets. Larger images put the creative under more scrutiny. Photos of the business owner, real work samples, and recognizable branding will get more screen time than small thumbnails ever did.
    • Measurement. As Local Service Ads continues its migration to Google Ads, reporting, bidding, and lead tracking will keep evolving. Watch the Google Ads interface, not just the search results, for changes to controls.

    How to prepare

    Local advertisers do not need to change anything today because this is a test, not a rollout. It is worth confirming that your Google Business Profile photos are current and high quality so that when a larger image asset starts showing, it represents the business well. It also helps to keep an eye on which queries are currently triggering your Local Service Ads versus traditional Search ads, since the migration will affect how spend is split between the two.

    Local Service Ads already rank by proximity, reviews, and responsiveness rather than by bid, so the fundamentals stay the same even as the visual treatment changes around them. That means the path to better performance runs through the business profile and review generation, not through higher bids.

    FAQ

    What is changing in Google Local Service Ads?

    Google is testing a larger image and a highlight box beneath Local Service Ads listings, which makes the ad units bigger and more visually prominent in the search results.

    Is this a full rollout or just a test?

    This is a test, not a confirmed rollout. Larger image experiments for Local Service Ads have appeared in past years as well, and those did not all become permanent designs.

    Why is Google investing more in Local Service Ads?

    Google is migrating Local Service Ads into the main Google Ads platform and is serving them in more placements. The larger visual treatment fits that broader push to make the format a bigger part of search advertising.

    BizScoreAI

    BizScoreAI, which includes the free listing check

    BizScoreAI has the free listing check scores how visible a business is to AI search and shows what its listing looks like to the engines people ask. Open the free listing check.


    This article summarizes reporting from seroundtable.com.

  • Calls and clicks keep falling as Google Maps becomes the destination

    Calls and clicks keep falling as Google Maps becomes the destination

    Google Maps is becoming the place where local searches end, and the new data shows just how much calls and clicks to business websites are slipping as a result. The shift is changing how local businesses capture customer action online.

    For local businesses, the takeaway is clear: appearing in Maps is no longer enough. The map result itself now absorbs calls, directions, and browsing that used to land on a business site, which means a complete profile, accurate hours, and strong photos matter more than ever.

    What the data shows

    The core finding is that user actions like calls, website clicks, and direction requests are trending down even as Google Maps usage continues to climb. Users increasingly resolve their intent inside the Maps interface, whether by tapping to call, reading reviews, or checking photos, without ever visiting the business website.

    This pattern echoes a broader shift across Google Search itself, where AI Overviews and AI Mode are answering more queries directly on the results page. Maps appears to be following the same playbook: keep the user inside Google’s environment rather than handing them off to a third-party site.

    Why Maps is absorbing the customer journey

    Three forces are working together to turn Google Maps into a destination rather than a directory:

    • Richer profile features. Business Profiles now surface photos, posts, menus, service lists, and Q&A directly in the Maps panel, reducing the need to click through.
    • Action shortcuts. Call, directions, save, message, and book buttons sit right inside the map result, letting users complete a task in one tap.
    • Local intent already exists. Most map searches carry commercial or navigational intent, so users arrive ready to act, not to research.

    Combined, these factors mean a Maps listing is increasingly a complete storefront. The website becomes a supporting asset for the users who still click, rather than the main stage.

    What this means for local SEO

    Local optimization priorities shift when the map result does the closing work:

    • Profile completeness matters more than website traffic. Hours, categories, attributes, photos, and posts all live inside the Maps panel where the customer now decides.
    • Reviews carry more weight. With less on-site research, star ratings and recent review sentiment are doing the persuasive work that a landing page used to do.
    • Call and direction tracking need a refresh. Attribution models that assume a website visit as the conversion event will undercount the customers who called straight from Maps.
    • Website pages should support, not anchor. Build pages that answer the deeper questions a committed customer has, not the discovery questions Maps already covers.

    The wider context: Google keeping users on Google

    Maps is one piece of a larger pattern inside Google properties. AI Overviews in main search answer factual queries without a click. AI Mode layers conversational follow-ups on top. Google Business Profiles continue to add features that used to live on business websites, from collected info to single-login management. Each move funnels more of the customer journey into a Google surface.

    For local businesses this is not necessarily bad news. The customers are still there, and many of them are closer to a transaction than ever. The opportunity is to make the Maps profile do the selling, then let the website do only what Maps cannot.

    FAQ

    Why are calls and website clicks from Google Maps falling?

    Users are completing more actions directly inside the Google Maps interface, using built-in call, directions, and browsing features, so fewer of them need to visit a business website.

    Does this hurt local businesses?

    Not necessarily. Customers still take action, but the conversion now happens inside Maps, which means a complete profile, accurate information, and strong reviews do the work that a website used to do.

    What should local businesses prioritize now?

    Focus on Google Business Profile completeness, recent reviews, and clear photos, and adjust attribution models to track calls and direction requests that never reach the website.

    Related coverage


    This article summarizes reporting from searchengineland.com.

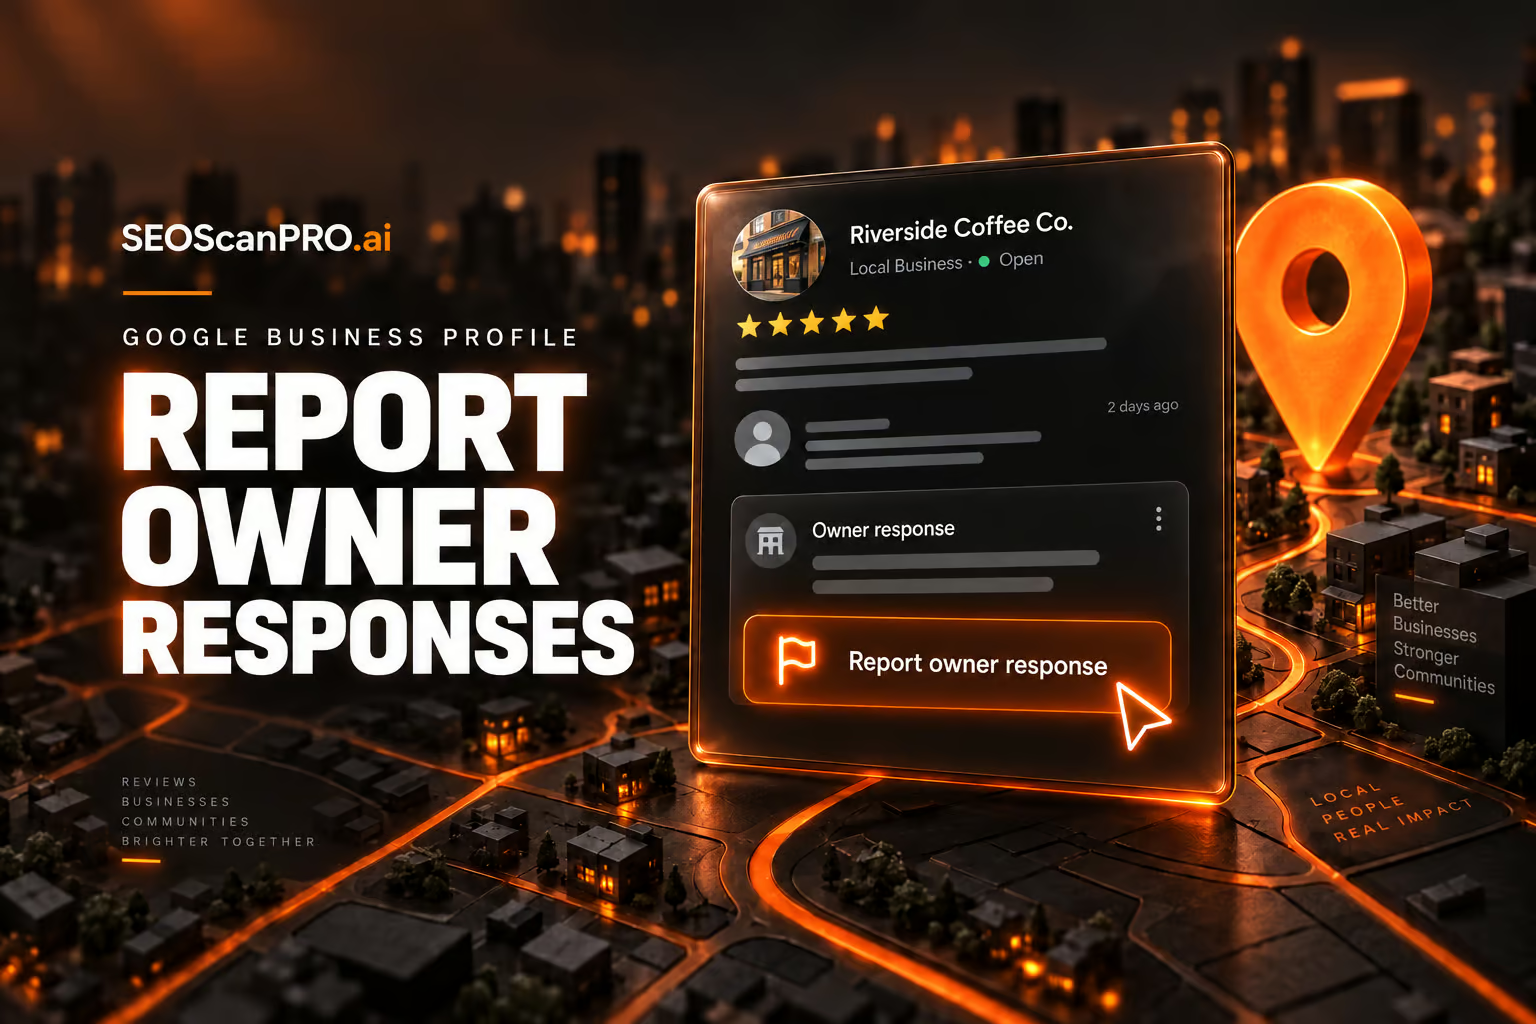
  • Google Business Profile Adds ‘Report Owner Response’ Option for Reviews

    Google Business Profile Adds ‘Report Owner Response’ Option for Reviews

    Google has added a new reporting option inside Google Business Profiles that lets people flag business owner responses to reviews when those replies cross the line. Users can now report owner responses that are off-topic, contain profanity, amount to bullying or harassment, include discrimination or hate speech, or expose personal information, giving reviewers a direct way to push back on unprofessional replies they previously had no tool to address.

    What the new reporting option covers

    The new option, called “Report owner response,” is surfaced directly on Google Business Profile listings and in Google Local. It is designed specifically for responses that a business owner has posted beneath a customer review, not for the reviews themselves. Anyone viewing the listing can open the reporting flow when they believe an owner reply violates one of the listed categories.

    The five report categories

    • Off topic: The owner response does not pertain to an experience at or with this business.
    • Profanity: The owner response contains swear words, has sexually explicit language, or details graphic violence.
    • Bullying or harassment: The owner response personally attacks a specific individual.
    • Discrimination or hate speech: The owner response has harmful language about an individual or group based on identity.
    • Personal information: The owner response contains personal information, such as an address or phone number.

    Beyond those five categories, users can also flag legal issues connected to an owner response through the same flow, giving Google a second channel for more serious cases that go beyond content standards.

    Why this option matters for businesses and reviewers

    Until now, there was no clean way for a customer to tell Google that a business owner’s reply to their review was inappropriate. Reporting options on Google Business Profile covered the review content, but the response sitting beneath it sat in a gray area. The new option closes that gap and gives Google a structured signal when owner replies cross into profanity, harassment, or the disclosure of private details such as bank account information, addresses, or phone numbers.

    For businesses, the change raises the bar on what counts as an acceptable public reply. A response that disputes a factual claim is still fair game; a response that insults the reviewer, shares personal details, or veers off topic can now be reported and removed through the same system Google already uses for problematic reviews.

    Where to find the new option

    The “Report owner response” entry appears on the listing alongside existing review controls. After selecting it, users see a form listing the five content categories above, plus the option to surface a legal issue. Submitting the form sends the report to Google for review under the same pipeline that already handles review-level abuse reports.

    FAQ

    What is the Google Business Profile “Report owner response” option?

    It is a new reporting entry inside Google Business Profiles and Google Local that lets users flag a business owner’s reply to a review when it is off-topic, contains profanity, amounts to bullying or harassment, includes discrimination or hate speech, or exposes personal information. Users can also report legal issues through the same flow.

    What reasons can a user select when reporting an owner response?

    The form offers five content categories: off topic, profanity, bullying or harassment, discrimination or hate speech, and personal information. It also lets users flag legal issues connected to the response.

    Can business owners report reviews through this same option?

    No. The new option targets owner responses, meaning the replies that businesses post under customer reviews. Reviews themselves are handled through Google’s existing review reporting tools.

    Related coverage


    This article summarizes reporting from seroundtable.com.

  • Inside Google Maps: 72 ranking signals and the architecture behind local search

    Inside Google Maps: 72 ranking signals and the architecture behind local search

    A recovered binary exposing part of Geostore, the system Google uses to represent geographic objects, sheds new light on how Google Maps actually works. The recovered material covers 72 Geostore ranking signals, 793 data source providers, 446 local search intent types, 50,998 Mapcore styles, 12,936 label styles, and 10,936 searchable Geostore declarations. The ranking signals get attention, but the architecture around them tells the more important story about how Google understands places.

    What Geostore actually is

    Google represents geographic objects internally as Features. A Feature can be a business, a building, a road, a city, a station, an area, a transit element, or a 3D object. For an establishment, the object can contain identity, geometry, source information, websites, business-chain relationships, Knowledge Graph references, concepts, and ranking information.

    The familiar Maps listing is assembled later. What a business owner edits in Google Business Profile is not necessarily what Google maintains internally as the entity. Google builds a canonical representation of the place that can incorporate data from multiple sources, survive changes in geometry, and connect to other Google identifiers, including the Knowledge Graph machine ID (MID).

    For local SEO, the entity is the more useful unit to consider. The listing is the interface. The entity sits underneath it.

    How 793 source providers shape a single listing

    One of the most revealing parts of Geostore is its provenance system. A business does not simply have one source. Its name might come from one provider, its phone number from another, its category from another, and its geometry from somewhere else entirely. The corpus exposes 793 source providers, along with mechanisms for provenance, priority, trust, and conflation.

    Conflation is the process used when several sources describe the same object and disagree. Geostore contains generic mechanisms that can pick one value, merge several values, or combine them. It also models trust levels ranging from blocked or untrusted sources to trusted and super-trusted ones.

    This gives a different interpretation to a common local SEO problem. Changing a field in Google Business Profile does not guarantee that Google’s canonical representation immediately becomes that new value. The edit becomes another piece of evidence entering a system that may already have competing evidence. For businesses struggling with persistent incorrect attributes, duplicate information, or changes that repeatedly revert, this architecture helps explain why the problem can be harder than editing a listing.

    How the archive pairs with Google’s 2024 documentation

    The binary itself gives structures, field numbers, and complete enumerations. Google’s March 2024 documentation often gives prose explaining what those structures mean. The recovered archive contains 10,936 Geostore declarations that can be searched by message name, package, field type, documentation text, tag number, status, and other properties.

    If a signal exists, the archive lets you find its declaration. If a field existed in the 2024 documentation, you can read the associated description. If a field has been stripped from the newer client scope, its protobuf tag still leaves a numbered hole. The 2024 leak gave many descriptions of Google’s systems. The newer binary gives much more of their actual vocabulary. Together, they provide a more useful picture than either source does on its own.

    What Oyster Rank’s 72 signals actually measure

    Geostore has its own ranking system. Internally, it is called Oyster Rank. A complete visible enumeration of 72 signals was recovered. The list includes Google reviews, web query volume, listing impressions, listing opens, direction requests, website clicks, chain membership, Wikipedia signals, popularity, prominence, landmark information, and road usage.

    Out of 72 values, 25 are explicitly marked deprecated. The important limitation is that the signal names were recovered, not their current weights. The schema shows a pipeline in which raw observations are extracted, normalized, and mixed into the Feature’s rank, but the coefficients that would tell how much each signal contributes are outside the recovered scope. SIGNAL_GOOGLE_REVIEWS proves that reviews belong to the Oyster Rank vocabulary. It does not prove that reviews currently carry a particular weight in a Maps search.

    Why 72 signals are not the Maps algorithm

    Oyster Rank appears to characterize the importance of the entity inside Geostore. A user query still has to go through additional systems. Maps must understand what the person means, identify a geographic context, generate candidates, evaluate semantic relevance, and serve a final result set. A simplified pipeline looks like: Geostore entity, query understanding, semantic matching, candidate generation, geography and quality, reranking, results.

    There are additional complications. A separate scorer runs entirely offline on the device. It has eight signals across 13 tiers and is distinct from both Oyster Rank and server-side Places ranking. There is no single Maps ranking formula. Different scoring and retrieval systems operate at different stages. Turning the 72 Oyster Rank signals into a checklist of 72 Google Maps ranking factors would miss most of the architecture.

    Why local search does not use a fixed radius

    A common local SEO model imagines Google looking within a predefined radius around the user and ranking the businesses found inside it. Measurements show something more dynamic. Using the same origin in Paris, the geographic footprint changed considerably depending on the query. A dense query such as “pharmacie” produced a far smaller search area than a brand query such as “Carrefour.” The environment matters too. The same pharmacy query expanded dramatically when run in a sparsely populated rural area.

    When geographic weighting was removed from the same engine across 5,083 calls and 86,584 results, the median distance moved from 6.87 km with geography to more than 4,000 km without it. The non-geographic order remained extremely stable. Geography is doing more than reordering the same list of candidates by distance. It changes what the retrieval system considers in the first place. Distance is still fundamental in local SEO, but “I am closer, I should rank higher” is an incomplete model.

    How Maps and the web connect through entities

    Geostore Features can connect to the Knowledge Graph through a MID. On the web index side, documents can also carry MIDs. Google has a layer called webref that associates documents with entities and stores information including topicality, confidence, geographic metadata, and document-level scores. The relationship also works at the document-ranking level. Recovered structures describe a relative ranking signal between different documents for the same entity, along with properties such as whether a page is an author page, publisher page, or reference page.

    This creates a different way to think about a store locator or location page. Its role may extend beyond ranking for queries such as “shoe shop Paris.” The document can become evidence about the underlying entity. The SEO objective is then partly to make it easy for Google to establish which entity the document describes, how much of the document is actually about that entity, how confident that association should be, and whether the document is a useful reference for it.

    How Google understands concepts, not just categories

    The semantic layer goes considerably beyond the primary category visible on a listing. Google uses GConcepts, a shared conceptual vocabulary that can describe businesses, dishes, attributes, cuisines, service modes, and other concepts. A simple “ramen” query followed through several parts of the system shows the search results did not all belong to one category. Google connected the query with ramen restaurants, Japanese restaurants, Asian restaurants, and other related concepts.

    Inside listings, the semantic representation goes deeper. Review topics, menu dishes, and other attributes can be represented as entities rather than plain strings. Semantic understanding becomes much more important when the interface starts answering complex questions.

    What lives on the phone itself

    Not everything is calculated on Google’s servers. On-device structures associated with visits, place candidates, frequent places, trips, home and work, mobility patterns, and user location profiles were found. One object, ChainAffinity, suggests the system can model affinity toward a recurring retail chain. The broader architecture is clear. The phone itself participates in building geographic context. Personalization in Maps can combine server-side knowledge of the world with a local model of the user’s own geography.

    Why ranking still does not guarantee map visibility

    Search results are only one of the outputs of Maps. The visual map has another problem to solve. Thousands of potentially relevant entities cannot all receive labels simultaneously. That job belongs partly to Mapcore, which holds 50,998 Mapcore styles and 12,936 label styles. Label visibility can change with zoom and other rendering conditions. A business can be eligible or highly ranked and still fail to appear as a visible name on the map.

    Search ranking and map visibility are separate optimization problems. This distinction becomes especially important when people measure Maps visibility using screenshots or map grids. The visual surface includes a rendering decision after retrieval and ranking have already happened.

    Why Gemini sits on top of this stack

    Google is rapidly expanding Ask Maps and other AI-powered experiences, but much of the infrastructure required to answer complex questions was already present. The system already has canonical place entities, semantic concepts and attributes, reviews and extracted topics, Knowledge Graph relationships, web evidence, geographic retrieval, behavioral signals, personal geographic context, listing composition, and ranking systems. Gemini adds a conversational interface over these layers. That changes what a local query can be. “Best ramen near me” is relatively easy. “Where can six people eat near my hotel tonight, with one vegetarian, little waiting time, and good recent feedback about service?” requires a different kind of place representation, and Maps has been building many of those ingredients.

    FAQ

    What is Geostore?

    Geostore is the system Google uses internally to represent geographic objects. It stores businesses, buildings, roads, cities, and other features as canonical entities that can connect to the Knowledge Graph and serve as the foundation for Maps listings.

    What is Oyster Rank?

    Oyster Rank is the ranking system inside Geostore. A recovered binary exposes 72 signals in Oyster Rank, including reviews, web query volume, listing impressions, direction requests, and popularity, but it does not reveal their current weights.

    Does Google Maps use a fixed search radius?

    No. Measurements show the geographic footprint changes with the query and the surrounding environment. Removing geographic weighting from the retrieval engine pushed median distances from 6.87 km to more than 4,000 km, indicating geography changes which candidates are considered rather than only reordering them by distance.

    Related coverage


    This article summarizes reporting from searchengineland.com.

  • Local SEO Keyword Research: A Practical Guide for 2025

    Local SEO Keyword Research: A Practical Guide for 2025

    Local SEO keyword research uncovers the exact words customers use when looking for nearby products and services, from city and neighborhood terms to “near me” queries. The process now needs to feed two discovery surfaces at once: Google organic and Local Pack rankings, and AI-generated answers from ChatGPT, Gemini, and Perplexity, including Google AI Overviews. The steps below show how to build a keyword list that supports both outcomes without doubling the workload.

    Why local search now has two evaluators

    A query such as best plumber in Denver gets judged twice. The first evaluator is Google itself: organic rankings that match web pages to the query and the Local Pack that matches a business profile to it. The second is AI-generated answers, where tools like ChatGPT, Gemini, and Perplexity recommend nearby businesses, or where an AI Overview composes a response from a handful of cited sources. Both surfaces drive local discovery, but each weighs a brand differently.

    Rankings reward how closely pages and profiles match the words people type. AI answers weigh the details behind the choice: availability, service area, pricing, licensing, and recurring review themes. Google Business Profile data and website content feed both, but ranking in one and appearing in the other are separate outcomes. One does not guarantee the other. A strong local keyword list therefore has one job with two outputs: helping pages rank and surfacing the questions, attributes, and location patterns AI systems draw on for recommendations like best [service] near [location].

    Where local keywords appear in Google

    A search for [service] in [location] can trigger several result types at the top of the page, including Local Services Ads with Google Guaranteed badges, a map-based Businesses or Places section (also called the Local Pack), and traditional organic results further down. Local keywords can trigger both Local Pack and organic results, but the ranking logic differs: organic results lean on on-page optimization and backlinks, while Local Pack rankings lean on GBP optimization, proximity, and review signals, which Google groups under relevance, distance, and prominence.

    What is local SEO keyword research?

    Local SEO keyword research is the process of finding the search terms people use to discover businesses, products, or services in a specific area. Optimizing pages for these keywords improves visibility in organic search results, driving more traffic, inquiries, and sales. Maps visibility and AI-generated answers depend on more than page content, as the steps below explain.

    Local keyword examples by intent

    The categories below show how search intent shifts by location, urgency, and proximity, and where each type fits in a content plan.

    • City-level (plumber boston, dentist austin, roofing contractor denver, family lawyer chicago): use when serving an entire city or operating multiple locations, with city-specific service pages.
    • Neighborhood-level (plumber south end boston, dentist downtown austin, coffee shop williamsburg brooklyn, yoga studio capitol hill seattle): use when serving a specific neighborhood, where competition is lower and intent is more specific.
    • Service plus urgency (emergency plumber, 24 hour locksmith, same day appliance repair, walk-in clinic): use for emergency or after-hours services.
    • Near me (plumber near me, coffee shop near me, urgent care near me, pizza delivery near me): use when optimizing a Google Business Profile to improve Local Pack visibility.
    • ZIP code and landmark (restaurants 10014, dentist near central park, hotels near fenway park, gyms in 78701): use when a business sits near a landmark or wants to capture ZIP-specific or tourist searches.
    • Service plus attribute (wheelchair-accessible dentist, pet-friendly hotel, Spanish-speaking lawyer, family-friendly restaurant): use when customers compare on a specific feature or audience need.
    • Commercial or availability modifier (affordable plumber boston, dentist open saturday, hotel with free parking, lawyer free consultation): use when customers compare price, availability, or practical details before choosing.

    Implicit vs. explicit local keywords

    Explicit local keywords include a location term like plumber in boston or dentist near me, making local intent obvious in the query itself. Implicit local keywords omit the location but still trigger local results because the intent is inherently local, and Google infers it from the searcher’s location.

    A London resident who lost their keys might search locksmith in london or locksmith near me, both explicit. Locksmith london drops the “in” but still names the city and is treated as explicit, with near-identical results. Someone searching just locksmith expects nearby options too, but the query never says so. That is an implicit local keyword, where Google infers the local intent entirely from the searcher’s position.

    Where results vary most is the searcher’s location. Google resolves every local query against where the searcher is standing, so two people in different neighborhoods, or different postcodes, can see meaningfully different results, especially for implicit queries where location is the only signal Google has.

    This matters for local SEO because it affects ranking eligibility (you can rank for implicit queries without exact “in [city]” phrasing as long as GBP optimization, proximity, and review signals are strong), explains ranking volatility when Google resolves location intent differently, and changes copy choices (you don’t need to say “in London” everywhere, since natural phrasing like “London locksmiths” still creates local relevance). The same logic applies to “near me”: repeating the literal phrase in titles and headers does not help rank for “near me” searches, because Google resolves that proximity signal from the Google Business Profile and location data, not from matching those two words on the page.

    How to do local keyword research

    Six steps cover the full workflow: list the terms customers use, expand them with research tools, verify local intent in the SERP, analyze competitors for keyword gaps, map keywords to pages, and research for AI visibility.

    Step 1: List terms for your solutions and locations

    Before opening any keyword tool, gather the exact words customers use when they contact the business. Call logs, staff notes, and chat transcripts show how real people describe services, problems, and locations in everyday language. Keyword tools measure demand for phrases people already search, but they cannot surface wording they have never seen enough people use. For example, one person may search for soda while another looks for pop: the same intent, different regional wording. A tool has no way of surfacing a variant that was never entered as a seed. Starting with customer language catches these variations before validating them in a tool.

    Reviews and local community posts on Reddit, Quora, and Facebook Marketplace are worth mining the same way, because people describe their needs in the language of a real conversation. The vocabulary carries across both evaluators, but the query format changes. Someone might type “24-hour plumber South End” into Google and ask ChatGPT, “Can you recommend a 24-hour plumber in South End who can come tonight?” Add both the compact search term and the fuller conversational question to the seed list.

    List the following solution-related terms: general terms for the business type, products and services people search for, problems or pain points the business solves, and questions or qualifiers customers use in those conversations. Then list location-related terms at multiple levels of specificity: city, neighborhood, ZIP or postcode, and landmarks such as near Fenway Park, near downtown, or near the airport. Service-area businesses, such as contractors, home service providers, or restaurants, should prioritize neighborhood and postcode terms, since they face less competition and attract searchers who want providers in their immediate area. Plumber south end boston may be easier to rank for than plumber boston.

    Step 2: Find relevant local keywords

    Use keyword research tools to expand the seed list, assess which terms are realistic to rank for, and see which queries surface local business results. Google Keyword Planner is a free starting point for keyword ideas and volume estimates. In the “Discover new keywords” section, enter seed keywords and a location under “Start with keywords,” then click “Get results.” Google provides broad volume ranges (such as 100-1K rather than exact numbers), and accepts city-level locations but not hyper-local neighborhoods or ZIP codes.

    For more precise data and local-specific features, Semrush’s Keyword Magic Tool is a stronger option. Open the tool, enter a seed keyword, add the site’s URL for domain-specific insights, choose the target country, and click “Search.” A list of keywords containing the seed keyword or a variation appears. Apply filters to surface local intent: select “Include keywords,” choose “Any keywords,” enter location modifiers, and click “Apply.” Include both city-level terms (boston, austin) and hyperlocal terms (south end, downtown, 02118, 78701), and run separate filters to compare volume and competition between city and neighborhood keywords.

    After entering a URL, look at the Personal Keyword Difficulty (“PKD %”) column, which rates difficulty based on the site’s authority and content relevance versus top-ranking competitors. Narrow the list by selecting the “Personal KD %” drop-down and setting a custom range of 0-49, representing terms with a realistic chance of ranking. Aim for a balance of search volume and feasible PKD%, and add relevant terms by selecting their checkboxes and clicking “Send keywords.”

    Local search volume and difficulty scores are directional, not exact, especially for hyperlocal terms. A keyword showing very low or zero volume may still represent real demand in a specific neighborhood that the data does not fully capture. When the numbers are ambiguous, the GBP category, service-area language, and reviews matter more than the volume figure alone.

    To find implicit keywords, clear the “Include keywords” filter and add location modifiers to the “Exclude keywords” filter to hide explicit queries. Then open “Advanced filters” and select “Local pack” under “SERP Features” to show only queries that trigger the Local Pack. Review these implicit local keywords for volume and Personal Keyword Difficulty, then send relevant terms to the list. The same filter panel is reused in Step 6 to check the list against AI Overviews.

    Before finalizing, check the Related tab as well, which surfaces conceptually connected terms that do not necessarily contain the seed keyword. Customer language that differs from internal phrasing often appears here. Apply the same location and difficulty filters there to keep results consistent.

    Step 3: Verify local intent in the SERP

    Search the keyword in Google and look at what actually shows up before investing time targeting it. Intent type, result format, and presence of Local Pack or Local Services Ads all confirm whether targeting the term is worthwhile. Verifying directly in Google catches cases where a “local” keyword only triggers organic results, or where a query that looks local is actually informational.

    Step 4: Analyze competitors to find keyword gaps

    Compare the keyword list against the terms competitors rank for, especially in the Local Pack and in organic results. Keyword gaps are terms competitors appear for that the business does not, and they often reveal underserved neighborhood or attribute combinations worth a dedicated page.

    Step 5: Map keywords to existing or new pages

    Assign each target keyword to a specific page on the site or to a profile element such as the Google Business Profile. City and service combinations typically map to city-specific service pages; attribute terms map to existing service pages where the feature is genuinely offered; “near me” terms are addressed through GBP optimization rather than page content.

    Step 6: Research for AI visibility

    Reuse the same keyword panel used for Local Pack checks, but this time filter for queries that trigger AI Overviews. AI answers pull from attributes, service descriptions, and review themes, so the priority list for AI visibility overlaps with, but is not identical to, the list for traditional rankings.

    FAQ

    What is local SEO keyword research?

    Local SEO keyword research is the process of finding the search terms people use to discover businesses, products, or services in a specific area. Optimizing pages for these keywords increases visibility in organic results, which drives more traffic, inquiries, and sales. Maps visibility and AI-generated answers depend on more than page content.

    How do implicit and explicit local keywords differ?

    Explicit local keywords include a location term like plumber in boston or dentist near me, making local intent clear in the query itself. Implicit local keywords omit the location but still trigger local results because the intent is inherently local, and Google infers it from the searcher’s location. Results for implicit queries vary more based on where the searcher is standing.

    Why target neighborhood and ZIP keywords instead of only city terms?

    Neighborhood and ZIP keywords face less competition than city-level terms and attract searchers who want providers in their immediate area. For service-area businesses, terms like plumber south end boston may be easier to rank for than plumber boston, and they often convert at a higher rate because intent is more specific.

    Related coverage


    This article summarizes reporting from semrush.com.

  • Google Business Profile Categories and Completeness: What 1.8 Million Profiles Reveal About Local SEO

    Google Business Profile Categories and Completeness: What 1.8 Million Profiles Reveal About Local SEO

    Whitespark analyzed 1.8 million Google Business Profiles across 4,209 categories to measure how category selection and Profile completeness influence local rankings. The dataset shows that specific primary categories, well-aligned additional categories, and fully completed Profiles all correlate with stronger visibility in Google Maps and local search.

    Specific primary categories rank better than generic ones

    Profiles with a specific primary category show a roughly 36 percent higher presence in the top 10 results than Profiles using a generic category, at 12.5 percent versus 9.2 percent. Average rank also improves, from 50.0 for generic categories to 45.8 for specific ones, across 55,091 generic and 1,664,733 specific Profiles in the study.

    The pattern holds inside individual verticals:

    • Attorneys: Criminal justice attorney averages rank 44.7 with 13.4 percent in the top 10; personal injury attorney averages 48.4 with 12.2 percent; the generic “Attorney” category averages 57.1 with 12.9 percent.
    • Contractors: Electrician averages 48.6 with 11.2 percent in the top 10; roofing contractor averages 53.1 with 12.6 percent; plumber averages 53.2 with 10.4 percent; HVAC contractor averages 53.2 with 12.4 percent. The generic “Contractor” category averages 57.7 with only 8.0 percent in the top 10.
    • Restaurants: Tapas averages rank 28.8 with 32.1 percent in the top 10; Hawaiian averages 28.4 with 27.1 percent; New American averages 30.4 with 28.9 percent. The generic “Restaurant” category averages 49.7 with only 10.1 percent in the top 10.

    Specific categories tend to face less local competition, and Google tries to match the primary category to the query, so a Profile labeled “HVAC contractor” is more likely to surface for an HVAC search than one labeled “Contractor.”

    A look at the “hair salons” search illustrates the same point at the category level. Profiles with the exact “Hair salon” category averaged rank 49.9 and appeared in the top 10 about 11.3 percent of the time. Adjacent categories trailed: Hairdresser averaged 56.9 with 6.0 percent, Beauty salon averaged 60.0 with 3.2 percent, Barber shop averaged 79.5 with 1.3 percent, and Nail salon averaged 81.3 with 0.0 percent.

    Which primary plus additional category combinations rank highest?

    After choosing a specific primary category, adding well-aligned additional categories correlates with stronger rankings. The strongest combinations in the dataset, compared to Profiles with no additional category and to Profiles that use “Service establishment” as the additional, include:

    • Veterinarian plus Emergency veterinarian service: average rank 33.9, versus 51.2 with no additional and 75.6 with “Service establishment.”
    • Electrician plus EV charging station contractor: average rank 38.2, versus 47.5 with no additional and 63.5 with “Service establishment.”
    • Gym plus Athletic club: average rank 34.7, versus 43.3 with no additional.
    • Plumber plus Drainage service: average rank 47.3, versus 54.0 with no additional and 62.3 with “Service establishment.”
    • Roofing plus Gutter service: average rank 47.1, versus 52.1 with no additional and 70.3 with “Service establishment.”
    • Personal injury attorney plus Business attorney: average rank 40.8, versus 51.4 with no additional.
    • Dentist plus Cosmetic dentist: average rank 47.6, versus 57.6 with no additional and 53.7 with “Service establishment.”

    Specific additional categories improve average rank by 6 to 17 positions compared to Profiles that only carry a primary category. The data also shows that broad, generic add-ons like “Service establishment” do not help. Profiles that used it ranked worse on average than Profiles with no additional category at all.

    Whitespark notes this is a correlation, not proof of causation. Businesses that take the time to add additional categories also tend to invest more in local SEO overall, which is likely part of why their rankings are higher.

    The GBP completeness index: how full is your Profile?

    To measure Profile completeness, Whitespark built a 0-to-5 index, awarding one point each for the presence of a website, a business description, hours of operation, photos, and a claimed status. The study did not include other Profile fields like attributes, services, or products.

    Completeness varies by industry

    Industries where local SEO drives real revenue tend to fill out their Profiles more completely. Home services Profiles averaged 4.4 out of 5 with 55 percent fully complete; professional services averaged 4.3 with 52 percent; automotive averaged 4.2 with 48 percent; beauty and personal care averaged 4.1 with 45 percent; legal and financial averaged 4.1 with 46 percent; retail averaged 3.9 with 40 percent; real estate averaged 3.8 with 38 percent; travel and tourism averaged 3.6 with 33 percent. Community and organizations, a largely noncommercial segment, averaged just 3.0 with only 22 percent fully complete.

    Completeness predicts rank

    Profiles that score 5 out of 5 average rank 43 and appear in the top 10 about 13 percent of the time. Profiles that score 0 average rank 62 and appear in the top 10 only 4 percent of the time. Moving from the lowest to the highest completeness tier improves average rank by roughly 19 positions and triples the share of Profiles in the top 10.

    • Score 5: average rank 43, 13 percent in top 10.
    • Score 4: average rank 47, 11 percent in top 10.
    • Score 3: average rank 50, 9 percent in top 10.
    • Score 2: average rank 54, 7 percent in top 10.
    • Score 1: average rank 58, 5 percent in top 10.
    • Score 0: average rank 62, 4 percent in top 10.

    Again, the relationship is a correlation. Profiles that are complete tend to belong to owners who also publish Google Posts, request reviews, and maintain their websites, so the ranking lift likely reflects a broader SEO effort, not Profile completeness alone.

    A practical checklist based on the data

    • Pick the most specific primary category that fits the business.
    • Add specific additional categories that match real services, and skip “Service establishment.”
    • Fill out every field on the Google Business Profile, including website, description, hours, photos, and claimed status.
    • Keep the Profile active after launch: request reviews, upload photos and videos, and publish Google Posts.
    • Layer in on-site SEO, citations, social presence, and AI search optimization, since GBP work alone is rarely enough in competitive markets.

    The category findings above are part of a larger Whitespark report on GBP categories that is slated for full publication.

    FAQ

    Does choosing a specific Google Business Profile category improve rankings?

    Yes. Across 1.8 million Profiles, those with a specific primary category appeared in the top 10 about 12.5 percent of the time, compared to 9.2 percent for generic categories like “Restaurant” or “Attorney,” a 36 percent relative lift.

    How many additional categories should a Google Business Profile have?

    The study found that adding specific, well-aligned additional categories improved average rank by 6 to 17 positions compared to using a single primary category. Generic add-ons like “Service establishment” did not help and were associated with worse rankings than having no additional category.

    Does a complete Google Business Profile rank better?

    Profiles that scored 5 out of 5 on Whitespark’s completeness index averaged rank 43 and appeared in the top 10 about 13 percent of the time, while Profiles scoring 0 averaged rank 62 with only 4 percent in the top 10. The relationship is a correlation, and complete Profiles tend to belong to owners who invest in broader local SEO as well.


    This article summarizes reporting from searchengineland.com.
  • Ask Maps gets more helpful with food ordering and more

    Ask Maps gets more helpful with food ordering and more

    Google Maps is rolling out a major upgrade to Ask Maps, adding agentic food ordering, hotel and event discovery, real-time transit delay tracking, and a new Personal Intelligence feature that draws on Gmail to personalize suggestions. The update, described by Google as the largest transformation of Maps in over a decade, combines Gemini model capabilities with map data and is shipping now in the United States, with broader country rollouts to follow.

    What is new in Ask Maps?

    Ask Maps, the conversational assistant inside Google Maps, can now handle multi-step tasks rather than just answering questions. The new capabilities break down into four areas: agentic food ordering and travel discovery, Personal Intelligence that factors in Gmail and Calendar, real-time transit updates, and conversational contributions from the Maps community.

    How does agentic food ordering work in Maps?

    Users can now ask Maps to place a takeout order before leaving the office. A request like "order spicy pad kee mao with seafood for me to pick up on my way home" prompts Ask Maps to find open restaurants along the route that serve the requested dish, factoring in saved places and dietary needs. Once a restaurant is selected, Ask Maps adds the dish to the cart for review and checkout.

    Food ordering is rolling out now with point-of-sale partners Square and Toast, with Uber Eats listed as a future integration. Google said the experience will continue to evolve as it co-develops the Universal Commerce Protocol for Food with partners.

    What can Ask Maps do for hotels and events?

    Beyond restaurants, Ask Maps can now compare real-time hotel prices and availability based on natural-language criteria. A query such as "find me a decently priced, top-rated hotel with an artsy vibe, within walking distance from a gym and restaurants" in a specific city returns matching options. For events, Ask Maps surfaces concerts, comedy shows, and other local listings with direct ticket links.

    How does Personal Intelligence use Gmail and Calendar?

    Personal Intelligence lets users opt in to connecting Ask Maps with Gmail, with Calendar support described as coming soon. Once connected, Ask Maps reads upcoming flights, hotel reservations, and dinner bookings to surface context-aware suggestions. For travelers, asking "Give me ideas on how to spend a few hours near the hotel before my flight tomorrow" returns recommendations tied to the hotel reservation in Gmail, along with departure timing for the airport.

    Google emphasized that Gmail connectivity is off by default and that the feature was built with privacy in mind. If history settings are enabled, Ask Maps also retains past conversations so users can resume planning, for example by asking it to recall earlier activity suggestions for a trip.

    What real-time transit information is available?

    A new transit widget inside Ask Maps displays up-to-the-minute delays for buses, trains, subways, and ferries. Asking about a specific route, such as a ferry with Opera House views on the way to Taronga Zoo, returns a virtual departure board. If a service is running late, the widget updates minute by minute so users know when to leave for the dock.

    This builds on existing live features in Maps, which already surface traffic, construction, accidents, and current wait times at shops and restaurants.

    How do conversational contributions work?

    Ask Maps and the Contribute tab now accept edits phrased as natural language. Users can upload a photo of a storefront sign and Ask Maps will read the new operating hours from the image, asking for confirmation before submitting. Users can also share insider tips, such as noting extra parking behind a building, and Ask Maps surfaces those notes to other community members. Submitted suggestions still pass through Maps’ built-in review systems and policy checks before publication.

    Where are the Ask Maps updates available?

    The live transit widget, Personal Intelligence, and conversation history are rolling out everywhere Ask Maps is already available. Food ordering, hotel and event discovery, and conversational contributions are rolling out now in the U.S., with additional countries planned. Ask Maps itself is also expanding to Australia, Brazil, Canada, Indonesia, Japan, and Mexico, joining more than 150 countries and territories where the feature is available in English.

    FAQ

    What is Ask Maps?

    Ask Maps is the conversational assistant inside Google Maps that lets users ask natural-language questions and now complete multi-step tasks like ordering food and comparing hotels.

    Which food delivery partners work with Ask Maps?

    Food ordering is rolling out with Square and Toast, with Uber Eats support listed as coming soon. Google is also co-developing the Universal Commerce Protocol for Food with partners.

    Does Personal Intelligence share my Gmail data by default?

    No. Connecting Ask Maps to Gmail is off by default, and users must opt in. Google states the feature was built with privacy in mind.


    This article summarizes reporting from blog.google.

  • Google’s AI Local 6-Pack: What It Is and How to Prepare

    Google’s AI Local 6-Pack: What It Is and How to Prepare

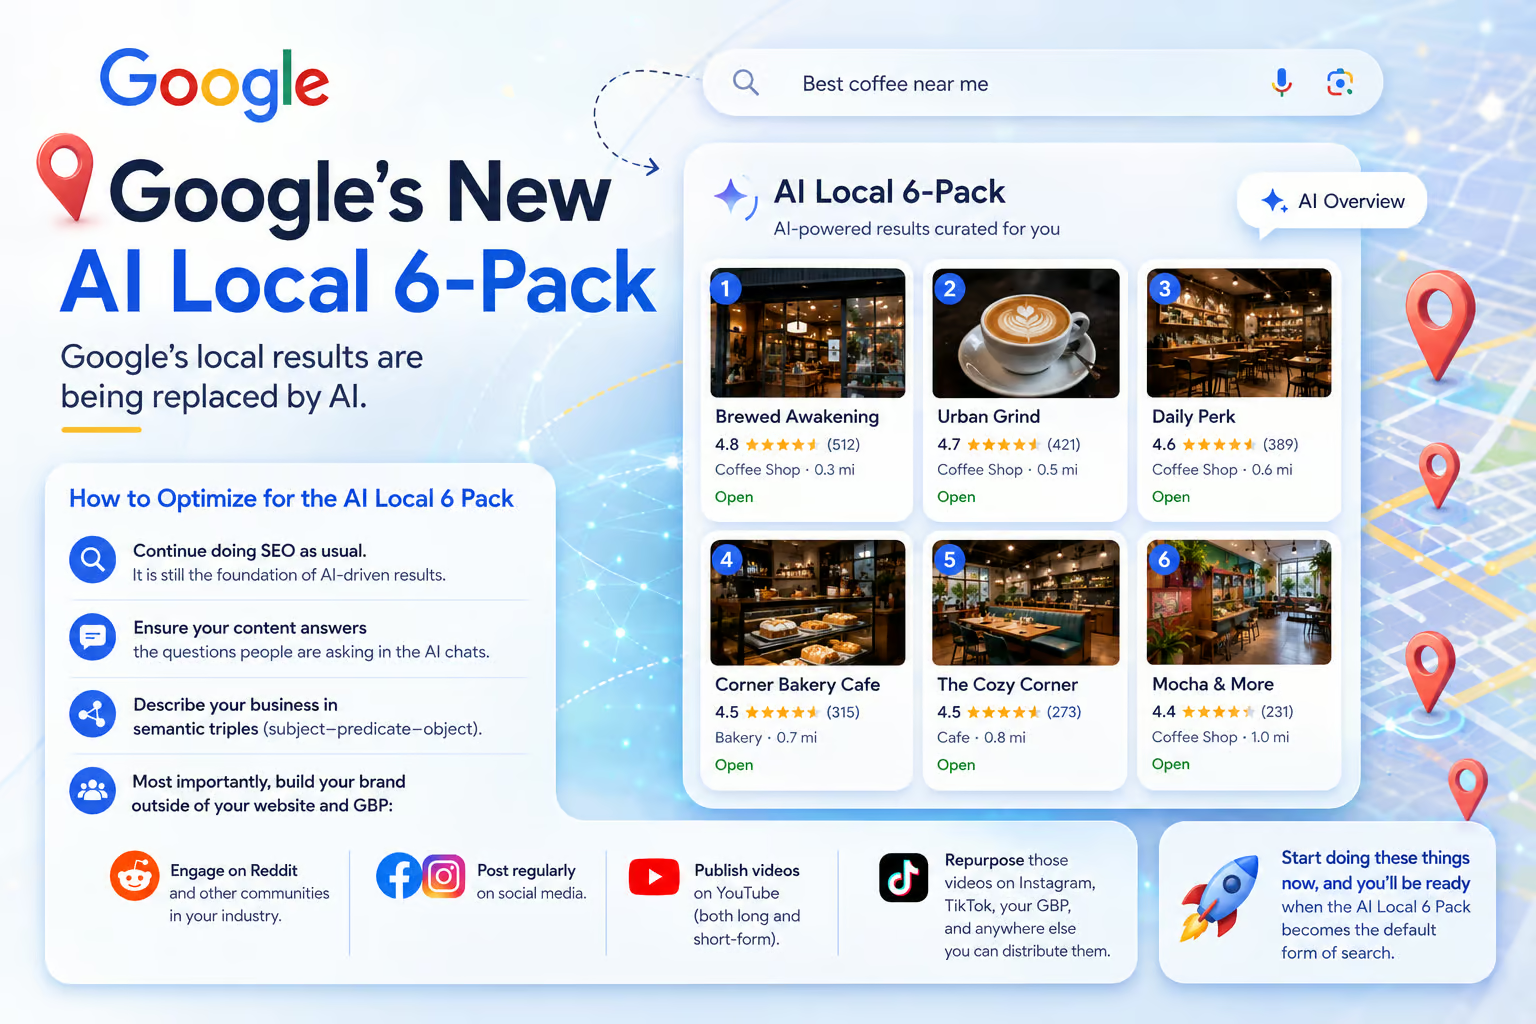
    Google’s traditional local results, long shown as the familiar map and listing block, are being replaced by an AI-generated format called the AI Local 6-Pack. The new layout shifts how businesses surface in local search, and it raises practical questions about how to keep getting found when the design of the results page itself changes.

    Below is a breakdown of what the change involves, why it matters, and the concrete steps that can help a local business stay visible in an AI-driven local search experience.

    What Is the AI Local 6-Pack?

    The AI Local 6-Pack is an AI-generated version of Google’s local results panel. Instead of the standard mix of map pins, star ratings, and business listings, the new format uses AI to assemble a local answer directly in the search results.

    The change reflects a broader shift in how Google constructs results. AI-driven layouts pull from the same underlying signals as traditional local search, but they reorganize those signals into synthesized answers rather than a list of links and map markers.

    Why It Matters for Local Businesses

    If your business currently earns placement in the local pack, you already depend on a narrow slice of screen real estate. An AI-generated layout changes which information gets surfaced, how it gets summarized, and which businesses get named in the answer.

    For businesses that have built their local visibility through consistent SEO work, the transition is less about starting over and more about adjusting tactics to match the way AI systems read, interpret, and present business information.

    How to Optimize for the AI Local 6-Pack

    Keep Doing Foundational SEO

    Standard SEO remains the foundation of AI-driven local results. On-page optimization, technical health, backlinks, and accurate business information all still feed the signals that AI systems use. Cutting back on basics to chase new tactics is a mistake; the new format layers on top of existing ranking systems rather than replacing them.

    Write Content That Answers Real Questions

    AI search experiences lean heavily on content that directly answers the questions people type into conversational queries. Pages that anticipate and respond to those questions in plain language are more likely to be pulled into an AI-generated local answer.

    This means auditing your site content with an eye toward the actual phrasing your customers use, not just the keywords you think you should target. The closer your content matches real search intent, the more usable it becomes for an AI system assembling a local response.

    Structure Business Descriptions as Semantic Triples

    One specific recommendation is to describe your business using semantic triples, a subject-predicate-object structure that AI systems can parse cleanly. An example would be: [Your Business Name] [offers] [emergency plumbing services in Phoenix].

    Semantic triples work well for AI because they mirror how knowledge graphs store information. The more consistently your business information can be mapped into those clean relationships, the easier it is for an AI system to slot you into a relevant local answer.

    Build Your Brand Beyond Your Website

    The biggest change in approach is that off-site signals matter more than they did before. AI systems weight brand presence across the wider internet, not just on your own domain or your Google Business Profile. Building that presence takes sustained effort across several channels.

    Engage in Industry Communities

    Active participation on Reddit and other niche communities in your industry helps establish topical authority and gives AI systems more evidence that your business is genuinely part of the conversation in your space. Genuine engagement, thoughtful answers, and consistent presence tend to outperform promotional posting.

    Post Regularly on Social Media

    Social media activity contributes to the broader signal set AI systems use to evaluate brand presence. Regular posting keeps your brand visible across platforms and gives AI more material to draw from when deciding which businesses to feature in a local answer.

    Publish Videos on YouTube

    YouTube remains a high-value surface for AI-driven local search. Publishing both long-form and short-form video content gives you more entry points into AI-generated answers, and video is increasingly pulled directly into search results.

    Repurpose Video Content Widely

    The same videos should be distributed across Instagram, TikTok, your Google Business Profile, and any other platform where your audience spends time. Repurposing maximizes the reach of each piece of content and builds the kind of cross-platform presence that AI systems read as a strong brand signal.

    When Should Local Businesses Start?

    Now. The AI Local 6-Pack is framed as the future default form of local search, and the brands that build off-site presence and structured content early will be better positioned when the new format rolls out broadly. Waiting for the change to fully land means starting from behind competitors who have already invested in these signals.

    FAQ

    What is Google’s AI Local 6-Pack?

    The AI Local 6-Pack is an AI-generated version of Google’s local search results panel. It replaces the traditional map and listing format with an AI-assembled local answer.

    Does traditional SEO still matter for the AI Local 6-Pack?

    Yes. Standard SEO remains the foundation of AI-driven local results. On-page optimization, technical health, backlinks, and accurate business information all continue to feed the signals AI systems rely on.

    What is a semantic triple in local SEO?

    A semantic triple is a subject-predicate-object description of your business, such as [Business Name] [offers] [service in location]. This format mirrors how knowledge graphs store information and makes it easier for AI systems to parse your business details.

  • The Query Deserves a Page Framework: An Audit Lens for Local SEO

    The Query Deserves a Page Framework: An Audit Lens for Local SEO

    When auditing a small business website for local SEO, the first thing to count is rarely the right thing to count. Most local sites carry dozens of near-duplicate pages: one per city, one per service combination, one per product variant. The technical question that should drive an audit is whether each of those URLs earned its place by satisfying the Query Deserves a Page (QDP) test. A page that fails that test is not free content. It raises Google’s cost of retrieval, dilutes PageRank, and opens the door to micro-cannibalization, where two of your own pages outrank each other and split the click.

    QDP adapts Amit Singhal’s older Query Deserves Freshness concept into a URL-level decision rule. The aim is depth on a smaller set of pages rather than thin coverage across many. For an auditor, this reframes the work: stop asking “how many pages should we have?” and start asking “which queries actually deserve their own page, and which belong as a heading, a table row, or a product card on a page we already have?”

    What does a page need to qualify as a standalone URL?

    A query earns its own URL only when all four conditions below hold at once. Missing any one of them is a signal to fold the variation into an existing page instead.

    • Search demand. There must be a measurable query volume behind the variation. If no one searches for it, it cannot justify crawl budget, index entries, or PageRank spend.
    • Distinct entities. The variation should refer to a different entity, such as a different city, a different service class, or a different product, not the same entity rephrased.
    • Low similarity to covered queries. The variation must be meaningfully different from queries already served by other pages on the site. High similarity is what triggers duplicate detection.
    • Pattern fit. The variation should fit a query template the site already ranks for, so that any ranking gains can transfer to sibling entities in the same class.

    Run every existing URL through this list during an audit. The pages that fail one or more checks are the first candidates for consolidation.

    How does Google actually decide if two pages are duplicates?

    Google’s “Detecting query-specific duplicate documents” patent describes how the engine labels two documents as exact duplicates, near-duplicates, or fully unique, with the label depending on the query that pulled each document up. Some overlap is helpful: it justifies internal links and consistent anchor text between related pages. Once overlap crosses a threshold, the two pages start competing for the same query, which is the audit signature of micro-cannibalization.

    For local sites, the classic offender is a templated city page. Swap the city name, keep every other sentence, list, image, and schema block, and Google can collapse the set into a single ranking candidate. The site ends up with twenty URLs fighting itself rather than one URL ranking with confidence. In audit terms, compare the rendered text of suspected pages and measure the token overlap outside the city name. A high overlap with low unique entity coverage is a duplication flag.

    Why does query similarity matter for which page to write?

    Query similarity is a weighted similarity, not a string match. The paper “End-to-end query term weighting” by Michael Bendersky and Marc Najork’s team shows how BERT assigns heavier relevance weight to the brand in “Nike running shoes” than to “running” or “shoes.” A page written for that query has to reflect the same weighting in its vocabulary, triples, and structured annotations.

    Local SEO inherits the same logic. In “Los Angeles car accident attorney,” the city carries the heaviest weight. If multiple cities share that same heaviest term and the per-city demand is low, the cities belong as sections under one strong page rather than as separate URLs. An auditor should identify the heaviest term on every page and check whether two pages share the same heavy term with near-identical copy. If they do, neither page is winning as well as a merged version would.

    Where should the strongest page on the site point?

    Across the local SEO projects covered in the source material, the homepage is always aimed at the most important location-service pair: “rehab Thailand,” not “rehab” and not “Thailand.” The reasoning is mechanical. The homepage carries the highest PageRank on most sites and, after robots.txt, tends to be the most crawled URL in the log files. Pairing that crawl and authority budget with the single strongest commercial query gives the site its best chance of ranking.

    The same audits usually surface a different failure: the homepage, the About page, and the main service pages all cannibalize each other because PageRank, query relevance signals, click data, and the Google Business Profile website field feed every page at once. A useful audit signal is the gap between Semrush and Ahrefs local rank readings. Semrush tends to surface higher local rankings because it folds Google Business Profile data into its view, while Ahrefs does not. A wide gap between the two is often a sign that the GBP is carrying weight that the on-site pages should be carrying themselves, and that the on-site pages are splitting credit rather than concentrating it.

    How does topical authority connect to the audit?

    Topical authority, as the source article defines it, is historical performance multiplied by topical coverage, divided by the cost of retrieval, and read through visual semantics. Every unnecessary page raises the cost of retrieval. Every thin page lowers topical coverage per URL. The audit goal is to lift the ratio: better coverage per page, lower retrieval cost per query, stronger authority per URL.

    Visual semantics is the part of the audit most teams skip. Sections, tables, product cards, and information cards on an existing page carry their own semantic weight. A plumber who lists twenty towns as a structured table on one service page can deliver the same entity coverage as twenty separate URLs, without the duplication overhead. The audit should check whether the existing page already supports the variation visually and structurally before recommending a new URL.

    What does a QDP-driven audit checklist look like?

    • Inventory URLs by query template. Group every page by the query template it targets, such as “[service] [city],” “[product] [material],” or “best [service] near me.”
    • Score each template on the four QDP metrics. Search demand, distinct entities, low similarity, pattern fit. Flag any template that fails one.
    • Find duplicate or near-duplicate pairs. Render the pages, strip the variable token, and measure residual token overlap. Above a threshold, mark as a cannibalization pair.
    • Identify the homepage’s primary location-service pair. Confirm it matches the single most valuable commercial query. If not, flag for redirect or rewrite.
    • Check the heaviest term on every page. Two pages sharing the same heavy term with similar copy are candidates to merge.
    • Compare Semrush and Ahrefs local ranks. A wide gap signals GBP-driven rankings and on-site cannibalization.
    • Consolidate or expand deliberately. Merge failing templates into sections on a stronger parent page, then verify that the parent page covers the merged entities with proper headings, tables, and structured data.

    FAQ

    What is the Query Deserves a Page framework?

    QDP is a decision rule for local SEO built on Amit Singhal’s Query Deserves Freshness idea. A query earns its own page only when it has real search demand, distinct entities, low similarity to queries already covered, and a clear template pattern. Queries that fail any of those tests belong as sections, tables, or product cards on a page that already exists.

    Why does publishing more pages not always improve local rankings?

    Every extra page raises Google’s cost of retrieval and can cause near-duplicate URLs to cannibalize each other. When two pages target the same heavy term with similar copy, they split ranking signals rather than concentrate them, which weakens overall performance for the site.

    How should a small business decide which location or service pages to keep?

    Point the homepage at the single most important location-service pair, since the homepage usually carries the highest PageRank and crawl frequency. Apply the four QDP metrics to every other variation. Keep the URLs that pass all four and fold the rest into sections, tables, or cards on the parent page that already covers the cluster.

    Related coverage

  • Local Data Center Opposition Has Nearly Doubled in Nine Months

    Local Data Center Opposition Has Nearly Doubled in Nine Months

    Opposition to data centers built near residential areas has climbed from 42% to 71% in roughly nine months, according to Heatmap Pro polling. 55% of respondents now say they strongly oppose a nearby facility, a sharp intensification of public resistance that auditors, site owners, and infrastructure planners should treat as a measurable shift in sentiment, not a passing story.

    What the latest polling actually shows

    The headline figure is straightforward. Heatmap Pro’s most recent survey puts local opposition at 71%, with a 55-point share describing their opposition as “strong.” That figure is nearly double the 42% recorded in August 2025, and it sits above the 51% reading taken about three months earlier. The trend line is monotone upward across three consecutive samples, which is the kind of pattern that matters when a category (data centers) crosses from contested to broadly unwanted in under a year.

    A separate Gallup survey conducted in May reached a similar conclusion, reporting 70% of Americans opposed to local construction, up from 47% in late 2025. Two independent polls, conducted by different organizations using different question wording, landing within one point of each other is a strong signal. For anyone benchmarking community sentiment around a build site, these two data sets are now the reference points.

    Why the backlash is accelerating

    Electricity costs are the single biggest flashpoint. In the Heatmap Pro poll, 53% of respondents named data centers as a cause of rising power bills, up from 28% nine months earlier. That share rose faster than the headline opposition number, which suggests cost attribution is doing more work than general environmental unease.

    Water is the second pressure point. Specific reports have given abstract concern a local address. A Fayette County construction site was reported to have used 29 million gallons of water without a single bill while nearby residents complained of low water pressure. Georgia’s data center expansion has drawn complaints about water use, and similar concerns have surfaced in Virginia. Last year, reports linked an Amazon data center to rare cancers and miscarriages in a nearby community. The Gallup survey found Americans would rather live next to a nuclear power plant than a data center, which is a useful proxy for how the technology now compares against older industrial neighbors in the public mind.

    What regulators and the industry are doing in response

    In March, following a call from President Trump, major technology companies including Google, Microsoft, Meta, Amazon, Oracle, OpenAI, and xAI signed a voluntary “ratepayer protection pledge” at the White House. The pledge committed those firms to covering the energy costs of their rapidly expanding AI data centers rather than passing those costs on to local electricity customers. Because the commitment is voluntary, enforcement is limited, which is why parallel regulatory work is underway.

    FERC is preparing action on large-load interconnection rules. Congress has seen legislation that would require data centers to pay for grid upgrades. Several states and grid operators are advancing tougher requirements. Watchdogs have warned that surging AI data center demand is already helping push up wholesale power costs in some regions. For site owners and SEO professionals running technical audits, the practical takeaway is that the cost line item labeled “electricity” or “infrastructure” on nearby facility pages is no longer a neutral fact; it is increasingly the first thing a reader reacts to.

    How infrastructure anger is spilling into attitudes about AI

    Frustration over infrastructure is feeding into wider skepticism about AI. Layoffs attributed to automation and the proliferation of low-quality AI-generated content online have added to public discontent. Industry figures have pushed back. OpenAI CEO Sam Altman has claimed there is “zero evidence” of AI-related job losses. Altman has previously dismissed data center water-usage concerns as “fake,” before separately pointing to the large amount of energy required to “train a human.” At least one prominent economist has joined the pushback.

    None of that rebuttal changes what auditors can measure on a page. The underlying shift is that data centers, once discussed as neutral back-office infrastructure, are now treated by a majority of Americans as a local liability. Sites that cover the sector for technical, business, or SEO audiences should expect that framing to keep tightening, particularly in content that touches energy use, water consumption, or grid cost allocation.

    What this means for a site owner auditing their own pages

    If your site publishes anything adjacent to data centers, cloud infrastructure, or AI compute, now is a reasonable moment to check three things.

    • How cost burden is described. Any claim that data centers “lower local energy costs” or “have no impact on bills” now runs against the 53% attribution figure. Audit your copy for that claim specifically.
    • How water use is framed. “Negligible” or “within municipal averages” statements are increasingly likely to be contested in comments, on social, and by reporters. Make sure the underlying numbers are sourced and dated.
    • Whether the page acknowledges voluntary pledges. The ratepayer protection pledge is a real commitment from Google, Microsoft, Meta, Amazon, Oracle, OpenAI, and xAI, but it is voluntary. Pages describing it as binding overstate the deal.

    None of this requires a rewrite for every article. It does mean the tolerance for hand-waving on cost, water, and enforcement has shrunk, and the polling trend line suggests it will keep shrinking.

    FAQ

    How much has local opposition to data centers grown in the last nine months?

    Heatmap Pro polling shows opposition rising from 42% in August 2025 to 51% about three months ago and 71% in the most recent survey. A separate Gallup survey found opposition rising from 47% in late 2025 to 70% in May.

    What concerns are driving the increase?

    Rising electricity costs and water use are the most-cited concerns. 53% of Heatmap Pro respondents blamed data centers for higher power bills, up from 28% nine months earlier. The Gallup survey found Americans would rather live next to a nuclear power plant than a data center.

    What is the “ratepayer protection pledge” and is it enforceable?

    The pledge, signed at the White House in March by Google, Microsoft, Meta, Amazon, Oracle, OpenAI, and xAI after a call from President Trump, commits those companies to paying the energy costs of their AI data centers rather than passing them to local electricity customers. The commitment is voluntary, so enforcement is limited, which is why FERC, Congress, and several states are advancing separate requirements.

    Related coverage

  • What the New Gallup Poll on AI Data Centers Means for Site Owners Tracking Local Energy and Water Pressure

    What the New Gallup Poll on AI Data Centers Means for Site Owners Tracking Local Energy and Water Pressure

    A Gallup survey released on Wednesday found that 71% of Americans are somewhat or strongly opposed to AI data centers in their own communities, while only 53% would oppose a nearby nuclear power plant. The gap matters because data centers now rival small cities in electricity and water consumption, and the resulting grid and regulatory pressure is starting to ripple into the pages and products that depend on them.

    Why local opposition is climbing above nuclear levels

    The poll reports that 70% of respondents worry to some degree about the environmental footprint of facilities built to train and run AI models. Among those who oppose a nearby data center, half cite resource concerns: water withdrawal, energy demand, and the conversion of farmland or wildlife habitat. Another quarter point to quality-of-life issues such as higher utility bills and a broader rise in the cost of living. Only 7% of those surveyed strongly favor local construction, with another 20% somewhat in favor, and those supporters name job creation, tax revenue, and local economic growth as their reasoning. Opposition runs across most demographic and political lines, with women and Democrats far more likely than Republicans to strongly oppose new builds.

    Where the new scale comes from

    Traditional data centers that served internet and cloud workloads typically occupied around 100,000 square feet. AI campuses are a different category: multi-million-square-foot sites on hundreds of acres, packed with hundreds of thousands of graphics processing units. Their combined demand for computing, cooling, and storage has been compared to the energy use of hundreds of thousands of households. Water use is similarly outsized, with large facilities drawing on the order of five million gallons per day, comparable to a town of 10,000 to 50,000 residents.

    States, projects, and the names behind the buildout

    Construction is concentrated in Texas, Virginia, and Georgia, with major projects underway from OpenAI, Oracle, SoftBank, Amazon, and Microsoft. Northern Nevada has become one of the fastest-growing corridors, with facilities built or announced by Google, Microsoft, and Apple. The Lake Tahoe region illustrates the tension directly: roughly 50,000 residents have been told that NV Energy will stop serving them in 2027 so the utility can redirect that capacity to data centers nearby, leaving affected households until next May to find a new electricity provider.

    What site owners and auditors should actually check

    Public resistance changes what a technical SEO or sustainability audit should look at, because the same friction shows up in performance, compliance, and trust signals on the pages themselves.

    Electricity source and carbon claims on the page

    If a site markets a product as low-carbon, cloud-based, or green-hosted, verify the claim. Look for an emissions report or a real PUE figure linked from the page rather than a slogan in the hero section. Cross-reference any renewable energy contract against the host’s published regional grid mix, since data center buildouts in coal- or gas-heavy regions can quietly undermine a marketing claim.

    Water disclosures for AI-adjacent products

    Pages that promote AI features now face an audit question their predecessors did not: how much water does inferencing a query consume, and where does that water come from? If a product page is silent on water use while a regional utility is allocating capacity to AI customers, that silence becomes a liability. Check whether the company publishes a water-use effectiveness (WUE) figure per region, and whether the marketing copy aligns with the disclosed number.

    Performance budgets against grid instability

    When utilities redirect power away from residential customers, latency in the surrounding region can spike during peak hours. Run synthetic audits from nodes in the same ISO or balancing authority as the target audience, and watch Core Web Vitals during evening windows when household demand competes with data center draw. A page that loads in 1.2 seconds in a lab test can fall apart under real local load.

    Structured data for organization, funding, and permits

    Local opposition creates a rich ecosystem of news, council minutes, and environmental impact statements. If a brand is tied to a contested buildout, audit the Organization, FAQPage, and NewsArticle structured data to ensure official statements surface before opinion pieces do. Misaligned schema can let third-party coverage dominate the knowledge panel while the company’s own clarifications sit several scrolls below.

    Third-party scripts and tracking weight

    Data center electricity pressure has pushed several large platforms to throttle non-essential features or move to lighter inference stacks. Review third-party tags that depend on heavy remote calls, and flag analytics or personalization scripts that now run on degraded infrastructure. A tag manager audit that focused on vanity metrics last year may now be flagging real carbon and cost.

    What the demographics say about messaging

    Because opposition cuts across political lines but is stronger among women and Democrats, generic community-pushback framing on a landing page will not land uniformly. Audit copy for tone assumptions and make sure claim substantiation matches the audience reading the page. A site that speaks to datacenter-hosting communities needs sourcing that survives scrutiny from local press; a site that speaks to enterprise buyers needs sourcing that survives scrutiny from procurement.

    The bottom line for audits

    AI data centers are no longer a back-end story. The Gallup numbers, the multi-million-square-foot scale of new campuses, and the redirection of residential power in places like northern Nevada mean that audits now have a new mandatory section: energy source, water disclosure, regional performance, and the structured data that ties a brand to a contested facility. Pages that ignore that section will read as out of date within the next audit cycle.

    FAQ

    What did the Gallup poll find about local AI data centers?

    The poll found that 71% of Americans are somewhat or strongly opposed to AI data centers in their local communities, compared with 53% who would oppose a nearby nuclear power plant.

    Why are Americans opposed to nearby data centers?

    Seventy percent of respondents cited environmental worries, including electricity and water consumption. Half of those opposed pointed to resource concerns such as water use, energy demand, and loss of farmland or wildlife habitat, while nearly a quarter cited quality-of-life issues like higher utility bills and rising costs of living.

    How large are the new AI data center campuses?

    Pre-AI data centers typically spanned roughly 100,000 square feet. New AI campuses can cover millions of square feet and hundreds of acres, house hundreds of thousands of graphics processing units, and draw energy comparable to hundreds of thousands of households. Large facilities can also consume around five million gallons of water per day.

    Related coverage

  • Mobile-First Local Search Audit: What Site Owners Should Check After BrightLocal’s Latest Data

    Mobile-First Local Search Audit: What Site Owners Should Check After BrightLocal’s Latest Data

    BrightLocal’s latest consumer survey, fielded to 1,227 US adults who had searched for a local business in the previous three months, found that 73% began their most recent local business search on a mobile phone. Google Search was the starting channel for 52% of respondents, and Google Maps added another 9%. AI tools now appear in 23% of these search journeys, but only 18% of consumers using AI felt ready to contact the business an AI tool recommended. For site owners, the practical question is which technical and on-page checks deserve priority when the entry device is a phone and the verification step often happens elsewhere.

    What the numbers say about where local searches start

    The headline finding is that mobile phones now function as the default starting point for local discovery. Across the survey, 73% of respondents reached for a phone first, while computers accounted for 19% and tablets 8%. That pattern holds across age groups, though it softens for older shoppers:

    • 18 to 29: 71% mobile, 19% computer, 9% tablet
    • 30 to 44: 86% mobile, 12% computer, 3% tablet
    • 45 to 60: 77% mobile, 15% computer, 8% tablet
    • Over 60: 57% mobile, 33% computer, 11% tablet

    Because the starting device skews so strongly toward small screens, the first technical SEO checks should focus on how a site behaves there. Slow loading, hard-to-tap buttons, and contact information buried under a hero image directly hit the audience that arrives with the highest intent.

    Google still anchors the journey, but it is not the only stop

    Google remains the largest single channel for local search, with 52% starting on Google Search and another 9% on Google Maps. Including the full journey rather than just the first click, 71% of consumers used Google Search at some point. That leaves 39% of journeys beginning elsewhere: social media, AI tools, review sites, voice search, and Apple Maps, with no single alternative commanding a large share on its own.

    Three quarters of respondents (75%) used more than one channel during their most recent search, and decision windows were often under 30 minutes. Across the entire journey, social media appeared in 30% of searches, AI tools in 23%, and review sites in 19%. The flow also runs in reverse: about two in five consumers who began on social media, AI tools, voice search, review sites, or Apple Maps returned to Google to verify what they found.

    For an audit, that means ranking data drawn from a single channel or a single device understates how a business is actually discovered. Tracking both mobile and desktop positions is a starting point, but so is checking brand mentions on social platforms, review aggregators, and map services to see what a customer would encounter.

    AI usage is rising fast, yet trust is low

    AI is already part of the local search mix. During their most recent search, 23% of consumers used an AI tool, and 31% said they use AI for local business recommendations at least monthly. Only 19% said they would not consider AI for a local search at all. BrightLocal’s separate Local Consumer Review Survey reported that 45% of consumers used AI tools for local business recommendations in the past year, compared with 6% the prior year.

    Usage does not translate into trust. Of consumers already using AI for local searches, only 18% felt ready to contact the business the AI recommended. Among those who began their search on an AI tool, the follow-on behaviour looked like this:

    • 2% used AI as their only channel
    • 43% went on to check Google
    • 39% checked social media

    By comparison, 33% of consumers who started on Google Search stopped there. The pattern points to AI as a shortlisting tool rather than a deciding one, and the businesses that get chosen are the ones whose details hold up under verification on Google and social platforms.

    Audit checklist for a mobile-first, multi-channel local presence

    The data points to a sequence of checks a site owner can run, ordered by where the customer is most likely to encounter the business.

    Confirm Google Business Profile signals

    Since 52% of searches start on Google Search and 9% on Google Maps, the Google Business Profile is still the most influential single listing. Confirm that the business name, address, and phone number match what appears on the website, that hours are current, and that the primary category aligns with how the business describes itself. Check that the profile page renders cleanly on a mobile screen and that any photos load quickly.

    Test the mobile entry point

    With 73% of journeys starting on a phone, audit the homepage and any landing page a local customer might reach. Look for tap targets large enough for a thumb, readable font sizes without zooming, and contact details visible above the fold. Run a Core Web Vitals pass focused on Largest Contentful Paint and Cumulative Layout Shift on a throttled mobile connection, since slow loads and layout jumps are most visible on the device most users are on.

    Compare mobile and desktop rankings

    Mobile and desktop positions can differ for the same keyword, sometimes by several places. Track the priority local queries on both surfaces and note gaps. If mobile ranks are weaker, common causes include slower load times, intrusive interstitials, or content that is hidden on smaller viewports.

    Verify listings on social, review, and map services

    Social media appeared in 30% of search journeys, review sites in 19%, and Apple Maps sits among the alternative starting channels that 39% of consumers use at some point. Audit the business presence on each service that matters to its market and confirm the core information is consistent. Inconsistent addresses or phone numbers across directories create the kind of friction that pushes a customer to a competitor whose details agree.

    Check what AI tools say about the business

    Run a few prompt tests against the major AI assistants, asking for local recommendations in the categories the business serves. Note the descriptions, addresses, and attributes the tools return, since 43% of consumers who start on AI go on to verify that information on Google and 39% check social media. If AI tools return outdated hours, a wrong category, or no mention at all, that is the surface a business needs to fix before trust gaps widen further.

    Watch the trust signals consumers verify against

    Because verification is the conversion step, review count, star rating, and response history on Google and the major review platforms matter as much as the ranking position itself. Audit the volume and recency of reviews and confirm the business is responding, especially on the platforms consumers cross-check after an AI recommendation.

    What to prioritize first

    If audit time is limited, the data suggests a clear order. Start with the Google Business Profile, because Google still hosts the largest share of starting points and the largest share of verification clicks. Move next to mobile performance, since that is where the journey begins for the majority of consumers. Finish with listings consistency across social, review, and map services, and with a review of what AI assistants say, because those channels are growing fastest and are where verification gaps most often lose a customer.

    Mobile is the entry point, Google is the anchor, and accuracy across every channel is what turns a search into a contact. AI visibility is climbing, but it currently supplements the established channels rather than replacing them, which keeps the audit priorities in roughly the same order they have held for the past several cycles.

    FAQ

    What percentage of local business searches start on mobile?

    According to BrightLocal’s survey of 1,227 US consumers who searched for a local business in the previous three months, 73% began their most recent search on a mobile phone. Mobile led across every age group, reaching 86% among consumers aged 30 to 44.

    How many consumers use AI to find local businesses?

    During their most recent local search, 23% of respondents used AI tools, and 31% said they use AI for local business recommendations at least monthly. BrightLocal’s separate Local Consumer Review Survey found that 45% of consumers used AI for local recommendations in the past year, up from 6% the prior year.

    Do consumers trust AI recommendations for local businesses?

    Trust remains limited. Only 18% of consumers who used AI for local searches felt ready to contact the business the AI recommended. Among those who started on an AI tool, only 2% used it as their sole channel, while 43% went on to verify with Google and 39% checked social media.

    Related coverage

  • Google Business Profile GA4 Integration and AI Search Console Reports: What to Audit Now

    Google Business Profile GA4 Integration and AI Search Console Reports: What to Audit Now

    Google has tied two of its core local business products, Google Business Profile and Google Analytics 4, together through a native data link, and it has added a dedicated AI Search performance area inside Search Console. The combination means a small business owner can finally count the phone calls, direction taps, and bookings that originate from a profile, and can also see when content is cited inside AI Overviews, AI Mode, or Discover. For anyone running technical SEO audits, the change reshapes which KPIs and which data sources belong on the checklist.

    Why local reporting needed a rebuild

    Search traffic no longer behaves like a single river flowing toward a website. According to the 2025 SparkToro zero-click study, 68% of Google searches end without a click on a result. A user can find a business through a standard blue link, a Maps pin, an AI Overview snippet, a conversational Gemini session, or a voice query, and still never reach the business site. When the click disappears, the only signal left is an impression on a GBP card or a citation inside an AI answer.

    Local intent compounds the problem. Google consumer insights indicate that more than 40% of mobile searches with local intent convert to an in-store visit within a day, and the path often starts with an AI-generated summary that pulls from a GBP listing, structured data, and review content. Without a unified reporting layer, the owner of a single-location business has no clean way to connect an AI Overview impression to a phone call that happened three hours later.

    What changed in GA4

    The first release is a native linking path between Google Business Profile and Google Analytics 4, replacing the manual workarounds and third-party connectors that many sites depended on. According to Google’s support documentation, the link is set up inside GA4 under Admin, then Data Streams, then the Google Business Profile linking option on a web data stream.

    Once the link is active, four GBP interactions flow into GA4 as events:

    • Calls placed from the listing
    • Direction requests to the business
    • Website visits generated from the profile
    • Photo views on the profile

    Businesses that accept appointments through GBP also see booking events import into the same stream. The events surface in standard GA4 reports and can be sliced in explorations by date, campaign, or location, which is the first time a local operator can compare GBP activity against on-site behavior inside the same workspace.

    What changed in Search Console

    The second release is an AI Search tab inside the Performance report in Search Console. The tab breaks out impressions from AI Overviews, AI Mode, and Discover for both mobile and desktop. A page that is cited inside an AI-generated answer counts as an impression even if the user never scrolls to a link, and the count is tracked separately from classic web results.

    Google’s announcement on the Search Central blog describes the goal as letting site owners judge how much of their visibility depends on AI-generated surfaces. For an audit, the practical effect is that a property now has three impression pools to monitor: traditional search, Discover, and AI surfaces, and each one needs its own benchmark and its own follow-up action.

    How to audit your setup against the new reports

    For a site owner, the rollout is a checklist. The following steps translate the new reporting into work that can be done in an afternoon.

    Verify the GBP to GA4 link is active

    Open GA4, navigate to Admin, then Data Streams, then select your web data stream and confirm the Google Business Profile link. If the link is missing, set it up and note the date. Events only appear in reports from the date of activation, so the first task is to establish a clean baseline window going forward.

    Confirm the four event types are arriving

    In GA4, open Reports, then Engagement, then Events, and filter for the GBP-sourced event names. Calls, direction requests, website visits, and photo views should each appear. If any of the four is missing, the GBP listing may not have the corresponding feature enabled, which is itself a fix to flag during the audit.

    Build a GBP attribution exploration

    Create a custom exploration that filters sessions to users who triggered a GBP event, then compare on-site behavior, conversion rate, and revenue against the rest of the traffic. This exploration is the first time an SMB can compare a GBP-driven visit against an organic search visit inside the same report, and the gap between the two is often the most actionable finding on the dashboard.

    Open the AI Search tab in Search Console

    Inside Search Console, open Performance, then click the new AI Search tab. Confirm impressions are populating for your top pages. If a high-value page is missing, the audit should check whether the page has crawlable structured data, clear entity markup, and content that answers the questions Google’s AI surfaces for your target queries.

    Check structured data for agent-readiness

    Google has confirmed the rollout of Gemini Spark, a personal AI agent that can book appointments and complete purchases on a user’s behalf. For an audit, the relevant question is whether a machine can read the business’s phone number, address, hours, and booking link from the page. Run a structured data test on the homepage and the most important landing pages, and confirm that LocalBusiness, Organization, and any service-specific schema validate.

    Watch third-party dashboards for native support

    Tools such as intentgaps.com have begun surfacing AI Overview citation gaps alongside traditional keyword gaps. An audit should re-test whether those tools now ingest AI Search Console data, because a single dashboard view of both pools of impressions is faster to act on than hopping between Search Console and GA4.

    What to expect in the next reporting cycle

    Google has indicated that click and conversion data for AI Search impressions will arrive in subsequent releases. For local listings, the next expected update is revenue attribution tied to GBP-initiated calls and bookings, which would close the online-to-offline loop that has been missing from GA4 since the property launched. The Gemini Spark rollout also points toward reports that attribute agent-sourced sessions back to the GBP listing or structured data feed that enabled the reservation, a useful signal for any site whose revenue depends on appointments, deliveries, or bookings.

    FAQ

    How do I link Google Business Profile to GA4?

    Inside GA4, go to Admin, then Data Streams, then select your web data stream, then click Google Business Profile linking. Follow the prompts to associate the GBP account. After activation, GA4 imports calls, direction requests, website visits, photo views, and bookings as events. No code or third-party connector is required.

    Where do I find AI Search reports in Search Console?

    Open the Performance report in Search Console and select the new AI Search tab next to Search results, Discover, and Google News. The report shows impressions from AI Overviews, AI Mode, and Discover across mobile and desktop. Click and conversion data will be added in a later release.

    What is the difference between AI Overviews, AI Mode, and Discover?

    AI Overviews are the generative summaries that appear above traditional search results. AI Mode is a full-screen conversational interface where users ask follow-up questions and receive persistent AI-generated answers. Discover is Google’s feed of personalized content recommendations, now surfaced alongside AI-generated summaries. Search Console separates each surface so a site owner can see which one is driving impressions.

  • GA4 Now Tracks Google Business Profile Calls and Directions Natively: What SEO Auditors Need to Check

    GA4 Now Tracks Google Business Profile Calls and Directions Natively: What SEO Auditors Need to Check

    What just changed in GA4

    Google Analytics 4 has opened a native product link to Google Business Profile. Phone calls, taps for directions, bookings, and messages generated from a GBP listing now flow into the same GA4 property that already records website sessions and form submissions. The link lives under GA4 Admin, in the Product Links section, and it is rolling out to accounts gradually at no additional cost.

    For site owners who run technical SEO audits, the headline is that high-intent local actions that used to vanish into a separate GBP dashboard are now first-party data inside Analytics. Auditors who previously had to flag “attribution gap” as a known unknown on local SEO reports now have a measurement surface they can test, verify, and recommend.

    Which metrics land in GA4 and where they appear

    After linking, a dedicated GBP section becomes visible in the standard reports. Seven interaction types populate the view: total interactions, website clicks, calls, directions, messages, bookings, and menus. The Google Analytics Help documentation confirms that linking a Google Business Profile to an Analytics property surfaces Business Profile performance data inside Analytics, with no UTM parameters required because the connection is server-side.

    Two practical audit notes come out of that:

    • The metrics show up in acquisition and engagement reports, so auditors reviewing those report templates should expect a new data source and re-check any filter or segment logic that assumed only website traffic populated those views.
    • Data is retained for six months. Even if a property’s data retention setting is longer, GBP events older than six months will not appear, which affects any year-over-year comparison an audit might run.

    What the numbers say about why this audit gap mattered

    According to BrightLocal’s 2025 Local Marketing Survey, the average Google Business Profile receives 1,009 interactions per month, and 42 percent of those actions are calls or direction requests. The same survey reports that 73 percent of consumers have used a business’s profile to call or get directions. Until the GA4 link shipped, none of those interactions were visible inside GA4 reports, so any audit that relied on Analytics to model local conversion value was working from an incomplete dataset.

    That is the core reason auditors should treat this as a measurement fix, not just a dashboard convenience. A plumber, salon, or bakery that drives half of its profile actions through calls was, by definition, underreported in GA4. The audit implication is direct: every prior conversion baseline an auditor signed off on needs a recalibration note.

    How to audit the link itself

    The setup path is short enough to verify during an audit run:

    • GA4 Admin, then Product Links, then Google Business Profile links.
    • Click Link and pick the profile or profiles to connect.
    • Confirm, with editor or administrator rights on the GA4 property and owner or manager rights on the GBP.

    Auditors should check three things on a real account:

    1. The link actually exists and is active, by opening the GBP section under Reports.
    2. The seven metric types are populating with non-zero values once enough time has passed.
    3. Access controls match the team’s permission model. GBP owner access is broad, and a link created with the wrong account can quietly expose a profile to an unrelated GA4 property.

    The aggregation problem for multi-location sites

    If a brand links more than one Business Profile to a single GA4 property, every metric collapses into one aggregated dataset. There is no built-in per-location filter or segment in GA4 at this stage. For a multi-location SEO audit, that is a real limitation, because location-level decisions, such as which storefront to invest in, still require the GBP dashboard or the Performance API.

    Auditors working with multi-location clients should flag this clearly in the report. The integration improves top-level visibility but does not replace the granular location exports that franchise and chain operators depend on.

    What to add to the audit checklist this week

    For any client whose organic strategy leans on local search, the audit should now include:

    • A confirmation that the GBP-to-GA4 link has been created, with a screenshot for the deliverable.
    • A check on GBP completeness. A profile that is missing hours, categories, or service items will underperform on calls and directions before any tracking question even matters, because profile quality drives whether a user taps at all.
    • A name, address, and phone number consistency check across the major directories, since GBP remains a primary surface for local discovery and AI-driven answers.
    • A note in the conversion baseline that pre-link GA4 data did not include calls or directions, so any historical comparison needs a footnote.
    • A separate segment or exploration that isolates GBP-driven calls, because they will now distort totals in acquisition reports if treated as standard traffic.

    What is likely to change next

    Google has framed this as a phased rollout, which means the feature set will expand. Multi-location operators are an obvious constituency for per-profile segmentation, and a deeper tie-in with Google Ads is the natural next step. Once calls and direction taps can feed bidding algorithms as conversion signals, local search campaigns gain a measurement loop that did not exist before. Subproperties and audience building are also plausible extensions, since both already exist elsewhere in GA4.

    AI-driven discovery adds a second reason to watch this area. When a voice assistant or AI agent surfaces a business and the user calls, that call now lands in GA4 as a trackable event, giving auditors a way to measure leads that originate outside the traditional web journey.

    FAQ

    What metrics does the GA4 and GBP integration track?

    The integration tracks seven interaction types from a linked Google Business Profile: total interactions, website clicks, calls, direction requests, messages, bookings, and menus. They appear in GA4 under acquisition and engagement reports once the profile link is confirmed.

    Can an audit see per-location data when several Business Profiles are linked?

    No. Linking more than one GBP to the same GA4 property aggregates every metric into a single dataset with no per-location segmentation. Multi-location brands should keep using the Business Profile dashboard or the Performance API for location-level detail.

    How long does GA4 keep Google Business Profile data?

    GBP metrics in GA4 are retained for six months. Reports will not show events older than six months even if the property’s general data retention setting is longer, so periodic exports are needed for long-term trend analysis.